
After reading the now famous article about a ventilator valve that can be 3D printed for $1, compared to the traditionally-manufactured valve costing $11,000, I realized that the way 3D printing costs are calculated is still vastly oversimplified, which leads to reliance on two incomplete cost models. The most common says that unlike traditional manufacturing there are never economies of scale and that the cost per part stays constant, whether a single part or 100s of parts are printed. Another model is that 3D printing costs slightly decrease with the number of units as more parts are added to the build bed, and the average build time per part decreases.
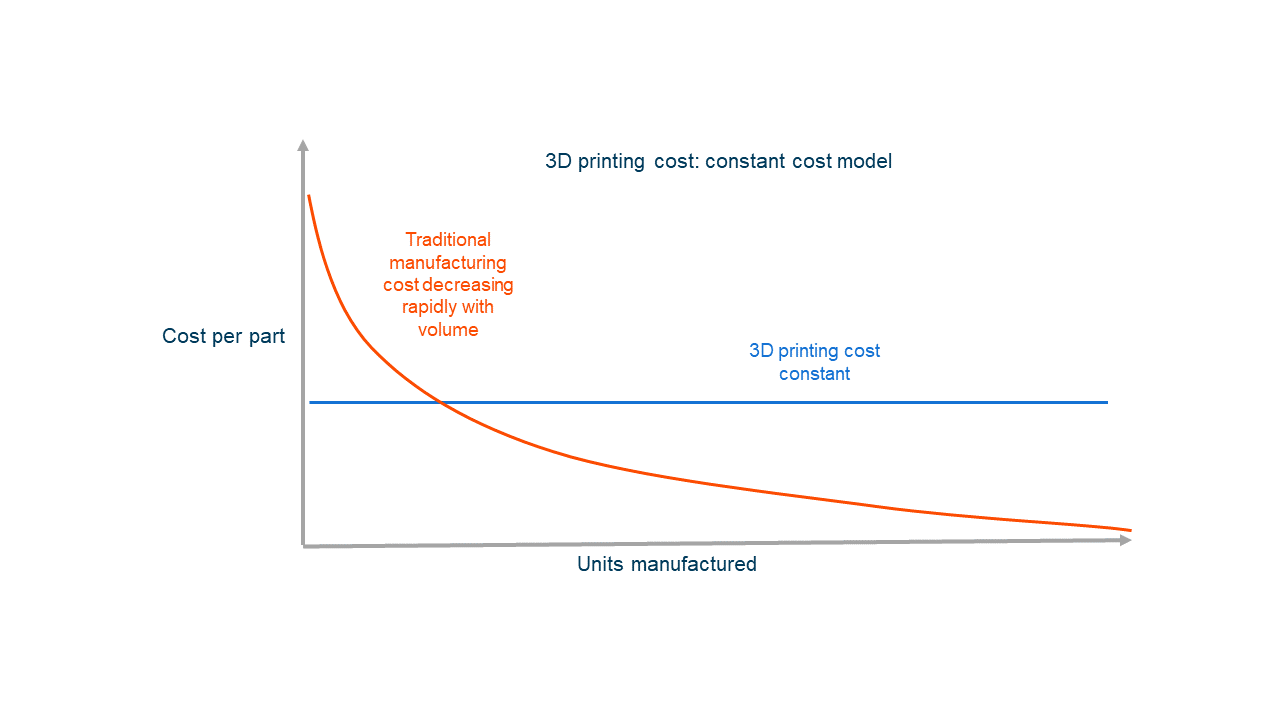
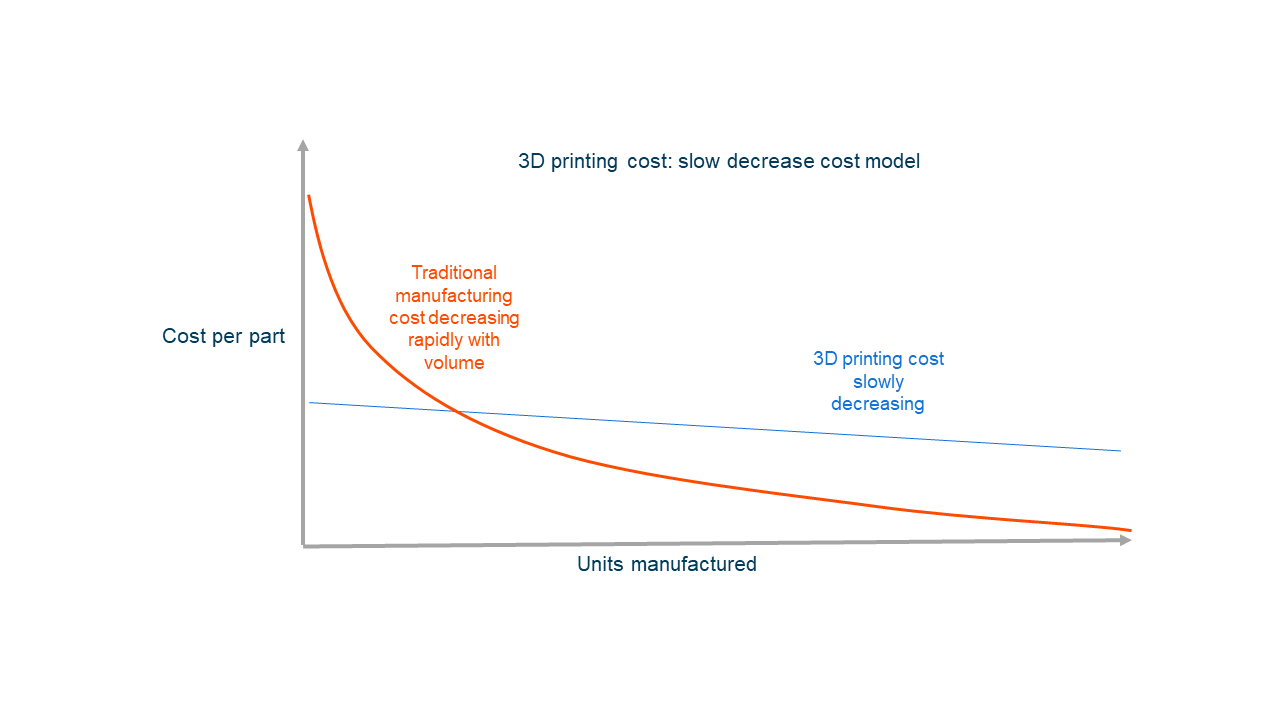
Figure 1: Common models of 3D printing costs
Both of the above models provide a cost approximation and are often used by service bureaus, but they both have the same flaw: They don’t take the machine utilization into account.
For 3D printing, there are five main cost contributors:
- Material cost: Material usage for the part, support material, and other material waste
- Machine depreciation: Portion of the machine price attributed to a part due to the time the machine is being used to build the part
- Consumable costs: The cost of consumables used for the build (build trays, argon gas, filters, printhead, etc.)
- Labor costs: Personnel cost involved in the build (build file preparation, machine preparation, build monitoring, machine clean-up, and support removal)
- Risk: Risk of failure involved in building this part. Usually comes in two different types, time risk – the longer the print, the higher the risk of failure, and geometry risk – certain geometries might have higher risk of failure for certain technology.
In this article we will take a deeper look at the machine depreciation cost and how machine utilization influences it.
Let’s start with a basic equation that is often forgotten or ignored but is essential to understanding the cost of 3D printed parts.
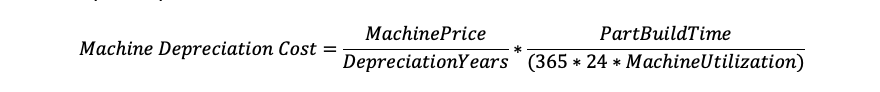
Figure 2: Machine Depreciation Calculations
The machine utilization is the percentage of the time during the year where the machine is producing parts. Because the utilization is in the denominator of the equation above, there is an inverse relationship between part cost and machine utilization. In other words, the part cost goes down as the machine utilization goes up.
Real machine utilization is very difficult to guess without having robust data available, so a lot of companies will use a fixed number for utilization. They often choose a number between 60% and 70%… a number that is often overly-optimistic.
Other companies with access to historical data will estimate machine utilization based on past figures. Many factors can influence the utilization figure, such as maintenance, down time, and build cleaning, but based on our experience the main contributors are staff availability to change builds and having enough parts to produce.
Staff availability is often forgotten because additive manufacturing is seen as an unmanned manufacturing process. While this is mostly true, staffing is still required for preparing and cleaning the machine between builds as well as monitoring if the build has failed. If a build finishes in the middle of the night with no staff available, a machine will sit idle, lowering utilization until the morning when a technician can prepare the machine for a new build.
To solve this, companies tend to schedule longer builds to complete outside of working hours. Scheduling builds in this way reduces the time a machine sits idle between builds.

Figure 3: Unoptimized build planning 62% utilization
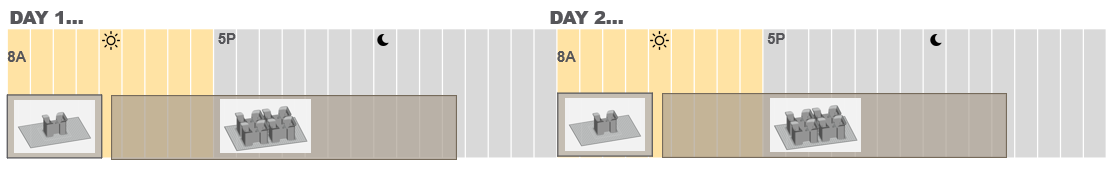
Figure 4: Optimized build planning 79% utilization
We have seen companies updating to a faster machine expecting cost savings due to better part throughput, only for the machine sit idle because there are not enough parts to keep it busy. If the machine can produce parts twice as fast but the number of parts produced per year is the same, then the machine depreciation cost per part stays the same.
Taking this into account, it is important to match the machine throughput to the part demand as closely as possible:
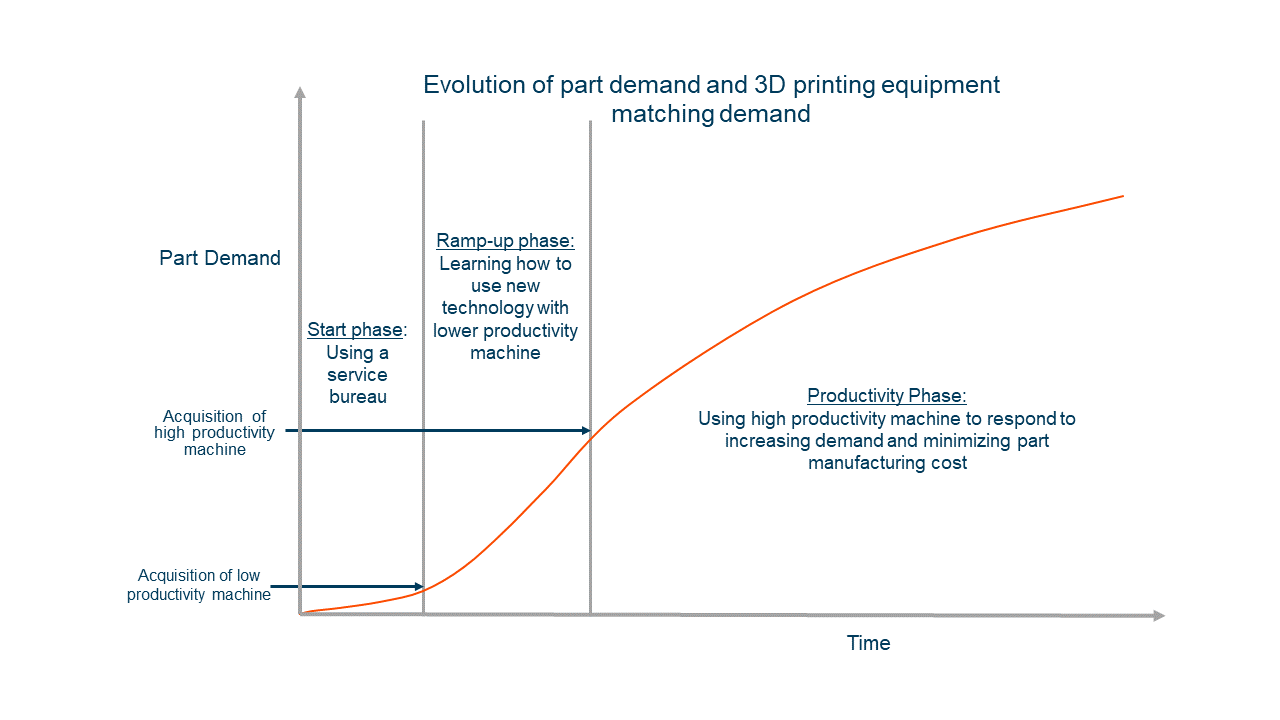
Figure 5: Production equipment matched with part demand
These two points show that 3D printing is similar to traditional production methods, where it is necessary to get throughput, part demand, and production planning right in order to minimize part manufacturing cost.
When taking into account machine utilization and how most users of additive manufacturing adopt the technology, we come up with the model below, which takes into account everything we discussed in this article and shows how the per part cost of 3D printing changes based on the number of parts manufactured and the number of machines needed to produce them:
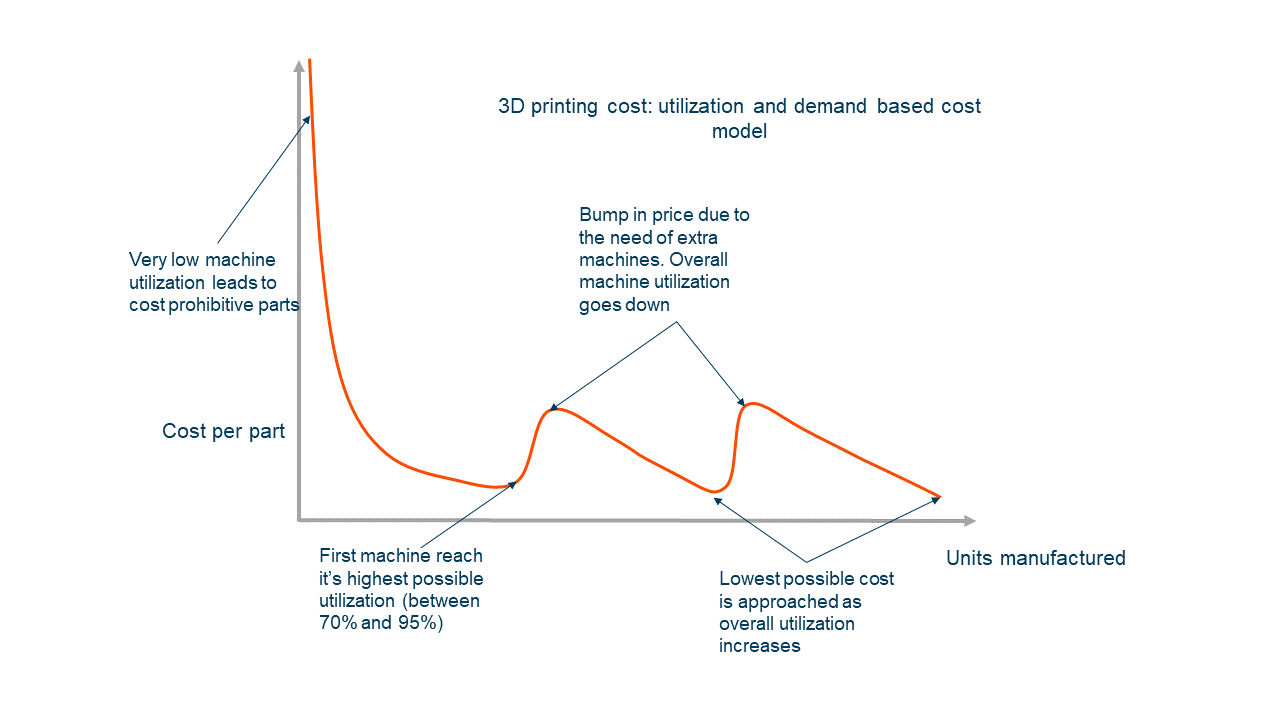
Figure 6: Realistic utilization-based cost per part
Based on the graph above we see that costs can be cut to a minimum if we can match the parts demand with the machine capacity. At Blueprint, when we create a ROI model for our clients, we often group many parts together to improve the machine utilization. Sometimes we will change the material of some parts or redesign a part so it can fit in a smaller build chamber. Knowing this, what should you do?
If you are looking into acquiring some production equipment, ask for real build time figures based on your parts, then plan what a typical week of builds will look like. This will help you to create a utilization-based ROI tailored to your specific conditions.
Once the machine is up and running, monitor its utilization. If it is low (below 60%,) identify the cause. Can you schedule builds better? If you don’t have enough demands for parts, invest into identifying and transitioning parts to additive; that investment will end up saving you money in the long run.
Also look at changing the design of your parts to lower build times. Getting training on design for additive manufacturing will lead to less material utilization and shorter build time which will improve your overall parts economics.
Regardless of the design changes needed, don’t be scared by the initial cost per part based on cost calculations on a limited number of parts. Keep in mind that any extra part you manage to identify and transition to additive manufacturing will lead to a part cost reduction on all your 3D printed parts. Keep monitoring your use of additive manufacturing and observe the costs are shrinking the more you use it and you are getting more expertise. Actively managing your machine utilization and investing in upskilling your workforce will be the keys to achieving the favorable economics of additive manufacturing.
Loïc LeMerlus
Loic leads the development of Blueprint’s algorithms that drive our proprietary analysis tools. He also works closely with many of our clients to analyze complex data and understand the economic impact that 3D printing and additive manufacturing could have on their businesses. In other words, he puts the numbers behind the hype. Loic has over 9 years leading projects to quantify the impact of the technology, working with users and vendors across the additive manufacturing industry.
Blueprint is an additive manufacturing consultancy, bringing together more than 16 years of knowledge and experience across the industry. As the world’s leading additive manufacturing consultancy, Blueprint regularly assists future-ready companies achieve additive success. Based in Eden Prairie, Minn., and Milford, U.K, the firm offers a unique, technology-agnostic perspective on all things additive, from strategic advice to design optimization services. More information is available online at www.additiveblueprint.com.
If you want to discuss this article or your additive manufacturing strategy, the team at Blueprint is here to help. Let’s talk.
The post The Real Cost of 3D Printing appeared first on 3DPrint.com | The Voice of 3D Printing / Additive Manufacturing.