3D Modeling & 3D Printing Can Improve THA Diagnosis, Classification, & Surgical Planning

The Electronic Presentation Online System, or EPOS, is the European Society of Radiology‘s electronic database for scientific exhibits. A group of researchers published in EPOS about their work using 3D modeling and 3D printing tools to diagnose, classify, and carry out surgical planning for fixing periprosthetic acetabular fractures, which are a difficult, but common, complication of total hip arthroplasty (THA).

“Periprosthetic acetabular fractures are related to traumatic events and pathologic underlining conditions that reduce the structural integrity of supporting bone[1] and often are associated with aseptic loosening, periprosthetic osteolysis and severe bone loss[2],” the researchers wrote.

“Analysis based on standard radiographs alone are not suitable to reliably detect the residual stability of the implant and measure the extent of the fracture and pelvic bone loss [3].”

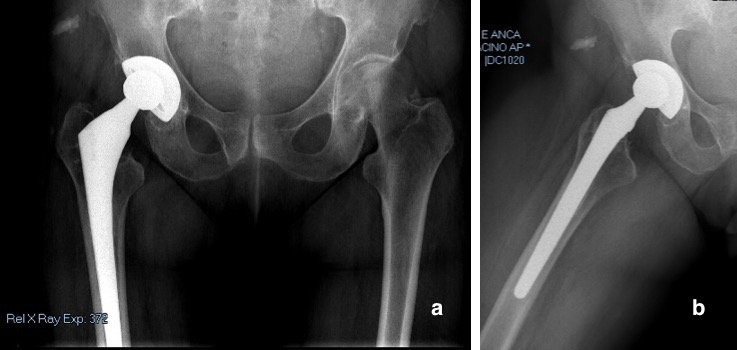
Fig. 1: (a) Anterior–posterior (AP) pelvis and (b) lateral view of right hip radiographs showed mild signs of periacetabular osteolysis without evidence of implant loosening and acetabular fracture.

They state that when it comes to defining a fracture pattern, CT scanning is “the gold standard,” which is definitely the case when a 3D virtual rendering is needed to help with surgical pre-planning.

3D modeling software based on CT scans allows clinicians to get precise images of “tridimensional reconstructions of the bony surface” by virtually removing metallic implants with segmentation. Other analytic tools include measuring remaining bone stock, evaluating implant stability, and characterizing the fracture, and 3D images can also be used to 3D print anatomical models for surgical planning and simulation purposes.

The researchers said their paper would show that bone quality and fracture morphology assessment can be improved with 3D modeling software, and reveal how useful 3D modeling and 3D printing are for the diagnostic process of periprosthetic acetabular fracture around THA, as well as making life-size models for pre-op implant templating, simulation, and sizing.

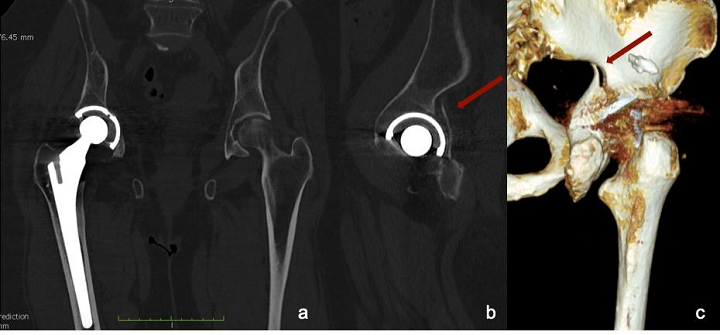
Fig. 2: CT scan of pelvis. (a) Coronal view shows slightly medially protruded acetabular cup; (b) sagittal view of the hip revealed posterior wall fracture of the acetabulum. The tridimensional reconstruction of the fracture is visible (c), but its extension is hidden by image artifacts.

They used the case of a 75-year-old woman who came to an ER after a domestic trauma incident. The patient had a history of severe coxarthrosis in her right hip, which had been treated a decade before using cementless THA. Doctors took AP radiographs of her pelvis, and a cross-leg view of her hip, and saw no signs of fracture or loosening around the acetabulum or the stem. However, a “CT scan of the pelvis with MAR protocol” showed that the posterior wall of the acetabulum did have a fracture, though the acetabular cup wasn’t displaced.

Materialise Mimics software was used to create a 3D digital model of the pelvis based on CT scan data. The bone was differentiated from surrounding soft tissue and the patient’s prosthetic implants through segmentation.

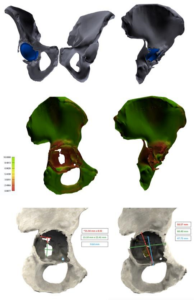
Fig. 3: Tridimensional images elaborated with 3D modeling software. (a,b) Entire pelvis with acetabular cup retained. Femurs and femoral stem were removed during segmentation. (c,d) Bone quality map shows regions with normal bone quality (green) and regions with low bone quality and thickness (red). (e,f) Measurements of the bone defect area and fracture extension.

“The first phase is thresholding, which includes all voxels whose density is within a specified range of Hounsfield Unit (HU) values. We used a mask with a HU range from 130 to 1750 in order to exclude metallic and ceramic implants and include both cancellous and cortical bone,” the researchers explained.

“The final segmentation, with the removal of soft tissues and artifacts, was manually performed using additional tools of the software (Fig. 3 a,b). Eventually, both femurs and metal implants were digitally removed from the corresponding pelvis and a 3D image of the isolated region of interest (ROI) was created.”

A bone quality map with a color gradient was used for the acetabulum, according to cortical and overall bone thickness of the various regions. Measures of the fracture’s area, shape, and spatial location were analyzed later, along with “the acetabular bone loss and the center of rotation, compared to the contralateral acetabulum.”

Finally, a life-size model of the patient’s entire pelvis was 3D printed on a Form 3L system.

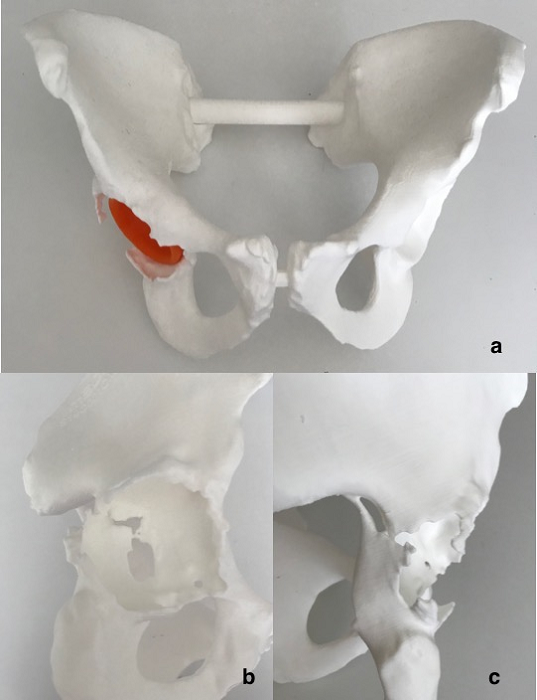
Fig. 4: (a) 3D printed life-size plastic model of the entire pelvis. (b,c) Particular of the medial wall and posterior column fracture.

After analyzing the 3D images and the 3D printed model, they re-classified the posterior wall fracture as an incomplete posterior column and medial wall acetabular fracture. Additionally, the fracture was found to be “spontaneous,” with less than 50% loss of bone stock. Finally, the bone quality map determined global bone loss, showing poor quality in both the posterior and medial walls. The 3D printed model was also used to perform pre-op templating.

“The treatment strategy was chosen according to the algorithm proposed by Simon et al. [14, 15, 16], which suggest the acetabular revision surgery bridging or distracting the fracture, without fracture fixation,” the researchers explained.

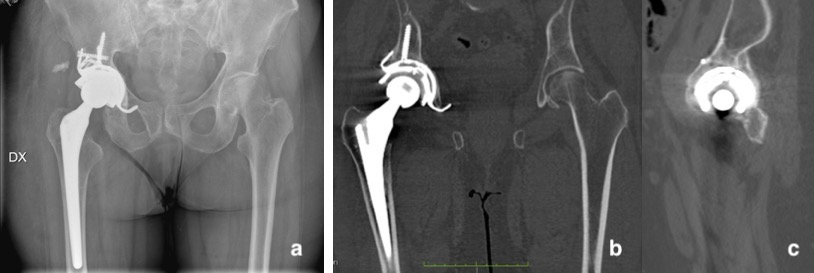
Fig. 5: (a) Postoperative AP radiograph of the pelvis and (b,c) CT scan of the pelvis at 3 months post-op shows good implant positioning and complete fracture healing.

AP radiographs taken of the pelvis and right hip post-op showed that the implant was “well-positioned and fixed.” Three months later, a CT scan was taken of the patient’s pelvis, which showed “bone integration of the trabecular cup” and complete fracture healing “with callus formation.” A 3D digital model built using DICOM images confirmed this.

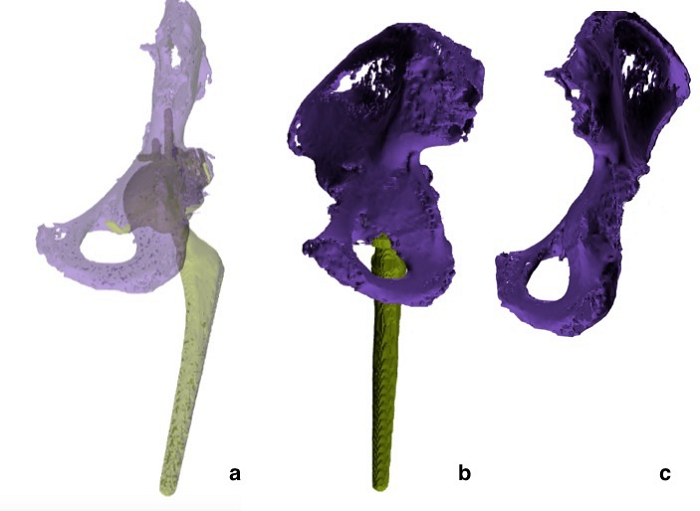
Fig. 6: 3D modeling digital reconstruction. The posterior column and medial wall of the acetabulum have been restored.

“The use of 3D modeling software showed that periprosthetic acetabular fractures can be better addressed, compared to plain radiograph and CT scans,” the researchers concluded.

“3D modeling software provide additional measurement tools which allow the volumetric analysis of bone defects and bone quality assessment.”

Discuss this and other 3D printing topics at 3DPrintBoard.com or share your thoughts below.

The post 3D Modeling & 3D Printing Can Improve THA Diagnosis, Classification, & Surgical Planning appeared first on 3DPrint.com | The Voice of 3D Printing / Additive Manufacturing.

What is Metrology Part 14: Image Restoration

Art Restoration and 3D Printing

Through this metrology series, I hope readers are making this realization: We as humans have faulty perception, and we try to understand our world as precisely as we can. The tools we use to measure items within our world are prone to error, but they do the best they can to reveal the essence of reality. The common adage is that a picture says a thousand words. If one has a blurry or weak picture, the words said are mostly confusing. Devices that take images can be used for metrology purposes as we have discussed earlier. The data that we capture in forms of images is necessary for high resolution and precise metrology methods. How do we make sure that images are giving us words of clarity vs. confusion?

Image restoration is the operation of taking a corrupt or noisy image and estimating the clean, original image. Corruption may come in many forms such as motion blur, noise, and camera misfocus. Image restoration is different from image enhancement in that the latter is designed to emphasize features of the image that make the image more pleasing to the observer, but not necessarily to produce realistic data from a scientific point of view.

Certain industries are heavily reliant on imaging. An example of the interdisciplinary nature of imaging and metrology is found in the medical sector. Biomedical imaging techniques need to be extremely precise for accurate measurements of internal organs and structures. Size, dimensionality, and volume are items that need high precision due to their affect on human life. Without proper images of these items, doctors and physicians would have a difficult time in giving proper diagnoses. Another important caveat to remember is the ability to replicate these structures through the use of 3D printing. Without accurately measured dimensions from 2D images, there would be a lack of precision within larger 3D models based off of these 2D images. We have talked about image stitching and 3D reconstruction previously. This is especially important within the medical field in the creation of 3D printed phantoms.

One can apply the same concept and thought process to the automotive industry. The automotive industry is all about standardization and replicability. There needs to be a semi-autonomous workflow ingrained within the production line of a vehicle. 3D scans are taken of larger parts that have been fabricated. With these original scans, replicability within production is possible. There still lies a problem of precision within an image. There are a lot of variables that may cause a 3D scan to be unreliable. These issues include reflective or shiny objects, objects with contoured surfaces, soft surfaced objects, varying light color, opaque surfaces, as well as matte finishes or objects. It is obligatory that a 3D scan is done in an environment with great lighting. With all of these issues, image restoration is essential with any scan because it is nearly impossible to have a perfect image or scan. Within the automotive industry, the previous problems are very apparent when scanning the surface of an automotive part. 

There are 4 major methods to image restoration that I will highlight here, but will expand upon within further articles.

Inverse Filtering

Inverse filtering is a method from signal processing. For a filter g, an inverse filter h is one that where the sequence of applying g then h to a signal results in the original signal. Software or electronic inverse filters are often used to compensate for the effect of unwanted environmental filtering of signals. Within inverse filtering there is typically two methodologies or approaches taken: thresholding and iterative methods. The point of this method is to essentially correct an image through a two way filter method. Hypothetically if an image is perfect, there will be no visible difference. The filters applied will correct any errors within an image though.

Wiener Filter

In signal processing, the Wiener filter is a filter used to produce an estimate of a desired or targeted random process through linear time-invariant filtering of an observed noisy process, assuming certain conditions are constant such as known stationary signal and noise spectra, and additive noise. This is a method that is focused on statistical filtering. This necessitates time-invariance because adding time into this process will ultimately cause a lot of errors. 

Wavelet-based image restoration

Wavelet-based image restoration is applying mathematical methods that allow for an image and its data to be compressed. With this compression, the ability to process and manipulate an image becomes a bit more manageable. Transient signals are best for this type of method. A transient signal refers to a short-lived signal. The source of the transient energy may be an internal event or a nearby event. The energy then couples to other parts of the system, typically appearing as a short burst of oscillation. This is seen in our readily available ability to capture a picture or image within a specific time frame. 


Blind Deconvolution

Blind deconvolution is a technique that permits recovery of the target scene from a single or set of “blurred” images in the presence of a poorly determined or unknown point spread function(PSF). The point spread function (PSF) describes the response of an imaging system to a point source or point object. A more general term for the PSF is a system’s impulse response, the PSF being the impulse response of a focused optical system. Regular linear and non-linear deconvolution techniques utilize a known PSF. For blind deconvolution, the PSF is estimated from the image or image set, allowing the deconvolution to be performed. 

We will be taking a deeper dive into this subject matter soon. As one can tell, there lies a vast amount of information and interesting technology and knowledge to be further understood. Through writing and experimentation with code, hopefully, I can show these things as well. 

The post What is Metrology Part 14: Image Restoration appeared first on 3DPrint.com | The Voice of 3D Printing / Additive Manufacturing.

What is Metrology Part 11: Computer Vision

In the previous article within our metrology series we took a look into what machine vision is as a whole and how it integrates within metrology. We also made a slight distinction in what machine vision is compared to computer vision. It is important to do so as these terms sometimes get mixed together as one term, but they are not necessarily the same. In this article, we will explore the definition of computer vision, its applications, and how it relates to metrology as a whole.

Doing Fun Stuff in Computer Vision

Computer vision is an interdisciplinary scientific field that deals with how computers can be made to analyze data from digital images or videos. From the perspective of engineering, it seeks to automate tasks that the human visual system can do.

Computer vision tasks include methods for acquiring, processing, analyzing and understanding digital images, and extraction of high-dimensional data from the real world in order to produce numerical or symbolic information. This information is then used to make decisions through artificial intelligence. The transformation of visual images into descriptions of the world can interface with other thought human processes. This image comprehension can be seen as the understanding of symbolic information from image data using models constructed with the aid of geometry, physics, statistics, and learning theory. We have talked about this a bit more indepthly in terms of complex analysis and geometry previously in this series. 

As a scientific discipline, computer vision is concerned with the theory behind artificial systems that extract information from images. The image data can take many forms, such as video sequences, views from multiple cameras, or multidimensional data from a medical scanner. Computer vision seeks to apply its theories and models for the construction of computer vision systems.

Some applications of computer vision include the following:

  • 3D reconstruction
  • Video tracking
  • Object recognition
  • 3D pose estimation
  • Motion Estimation 
  • Image Restoration

3D Reconstructed Truck

3D reconstruction is the process of capturing the shape and appearance of real objects. This process can be accomplished either by active or passive methods. If the model is allowed to change its shape in time, this is referred to as non-rigid or spatio-temporal reconstruction. Spatio-temporal reconstruction refers to 4D reconstruction as it is adding the 4th element of time into creating an object (x-position, y-position, z-position, and time). 

Video Tracking Example

Video tracking is the process of locating a moving object (or multiple objects) over time using a camera. It has many uses, some of which include: human-computer interaction, security and surveillance, video communication and compression, augmented reality, traffic control, medical imaging, and video editing. Video tracking is time consuming due to the amount of data that is contained in a video. The need for object recognition techniques in video tracking is very difficult as well. 

Object Recognition

Object recognition technology in the field of computer vision is used for finding and identifying objects in an image or video sequence. Humans have the ability to recognize a large amounts of objects in images with a lack of effort. We are able to do this despite the fact that the image of the objects may vary somewhat in different viewpoints, in many different sizes and scales, or even when they are translated or rotated. Objects can even be recognized when they are partially hidden from view. This task is still a challenge for computer vision systems. Many approaches to the task have been implemented over multiple decades.

3D pose estimation

3D pose estimation is the problem of determining the transformation of an object in a 2D image which creates a 3D object. One of the requirements of 3D pose estimation comes from the limitations of feature-based pose estimation. There exist environments where it is difficult to extract corners or edges from an image. To deal with these issues, the object is represented as a whole through the use of free-form contours.

Motion Estimation

Motion estimation is the process of determining motion vectors that describe a transformation from one 2D image to another; usually from adjacent frames in a video sequence. There lies a problem as the motion is in three dimensions but the images are a projection of the 3D scene onto a 2D plane. The motion vectors may relate to the whole image or specific parts, such as rectangular blocks, arbitrary shaped patches or pixels. The motion vectors may be represented by a translational model or many other models that can approximate the motion of a real video camera, such as rotation and translation in all three dimensions and zoom.

Image Restoration

Image Restoration is the operation of taking a corrupt/noisy image and estimating the clean, original image. Corruption may come in many forms such as motion blur, noise and camera mis-focus. Image restoration is different from image enhancement in that the latter is designed to emphasize features of the image that make the image more pleasing to the observer, but not necessarily to produce realistic data from a scientific point of view. Image enhancement is when one wants to use software such as Adobe Photoshop or Adobe LightRoom. With image enhancement noise can effectively be removed by sacrificing some resolution, but this is not acceptable in many applications. 

Within our next articles we will be looking indepthly into the previously outlined topics and relate them to the field of metrology as a whole.

The post What is Metrology Part 11: Computer Vision appeared first on 3DPrint.com | The Voice of 3D Printing / Additive Manufacturing.

US Army Research Lab Scientists Creating Atomic-Level 3D Reconstructions of Specimens

The US Army Research Laboratory (ARL) is responsible for plenty of innovative 3D printing research over the years, such as 3D printing drones and working with recycled 3D printing material. Now, material scientists from the ARL have their sights set on something much smaller that could have a very large impact – analyzing atomic-level metal and ceramic specimens.

Dr. Chad Hornbuckle, a materials scientist with the ARL’s Weapons and Materials Research Directorate, specializes in microstructural characterization using electron microscopes and atom probe tomography (APT), and is working on the atomic-level research. He said that the unique atom probe being used in this research not only sets the standard for accuracy in chemistry, but is also necessary to understanding the interior structure of materials themselves.

“The atom probe gives us a 3-D reconstruction at the atomic level. When you see the reconstruction that’s made up of millions of dots, the dots are actually individual atoms,” Dr. Hornbuckle explained.

“It’s basically the only machine in the world that can do this at the atomic level. There are machines, like transmission electron microscopes, or TEMs, that do chemical analysis, but it is not as accurate as this.”

Dr. Chad Hornbuckle, a materials scientist with the ARL, specializes in atom probe tomography, which analyzes ceramics or metal 1,000 times smaller than a human hair.

Because experiments require consistency, it’s extremely important to maintain a high level of accuracy during research like this.

Dr. Hornbuckle said, “You might have one effect one time, but if the chemistry changes, you get a completely different effect the next time. If you can’t control the chemistry, you can’t control the properties.”

If you thought working at the nanoscale level was small, consider this: the atomic-level specimens being analyzed in this research are roughly 1,000 times smaller than the end of a strand of human hair. Researchers have to create very sharp tips to get the samples ready for analysis, which are used to mill, or sandblast, the materials away using gallium and either a focused ion beam microscope or a dual beam scanning electron microscope. Then they are inserted into the atom probe.

The interior of the probe is a super cold vacuum. Atom samples are ionized with a laser, or a voltage pulse, within the probe’s tip, which causes them to field evaporate from the surface. Then, the evaporated ions are analyzed and identified, which results in a 3D model with a near-atomic spatial resolution.

Atom probe

Dr. Hornbuckle himself developed the probe during his time as a graduate student at the University of Alabama. Army scientists and other researchers now ask him for his help in characterizing samples, and use APT technology to determine which atoms are located where in a material.

Dr. Denise Yin, a postdoctoral fellow at ARL, said, “I can give you one specific example of how it’s helped our research. We were electrodepositing copper in a magnetic field and we found a chemical phase using the atom probe that didn’t otherwise show up in conventional electrodeposition.

“Electrodeposition is a process that creates a thin metal coating.

We were having problems identifying this phase using other methods, but the atom probe told us exactly what it was and how it was distributed.”

Dr. Yin said that the atom probe has “impressive” capabilities:

“You can see the atoms show up in real time. Again, it’s at the nanometer scale, so it’s much finer than all the other characterization techniques. The atom probe told us quite easily that the unknown phase was two different types of a copper hydride phase, and that’s not something that we could have detected using those other methods.”

[Image: ARL]

Only a limited number of these atom probes exist, and the one used by the ARL is one of just several in the US. So you can imagine that many universities hope to use it to analyze their own samples. As part of its Open Campus business model, the lab looks for formal agreements.

ARL Director Dr. Philip Perconti explained, “Open Campus means sharing world-class ARL facilities and research opportunities for our partners. A thriving Open Campus program increases opportunities for technology advancement and the transfer of research knowledge.”

Dr. Hornbuckle said that a partnership with Lehigh University yielded some “important results.”

Army scientists explore materials at the nano-level with the goal of finding stronger or more heat-resistant properties to support the Army of the future.

“One university that we collaborate with is Lehigh University. At first, this collaboration was more of a mutual exchange of expertise, where I analyzed some of their samples in the atom probe and they used their aberration-corrected transmission electron microscope to analyze some of our copper-tantalum sample,” said Dr. Hornbuckle. “We now have a cooperative agreement with them to continue this collaboration.

“I actually ran a nickel-tungsten alloy that was electrodeposited for them and identified and quantified the presence of low atomic number elements such as oxygen and sodium. This resulted in one research journal article with several more in preparation.”

The ARL is also collaborating with Texas A&M University on atomic-level analysis.

“This collaboration initiated due to the Open Campus initiative. I have analyzed a few nickel-titanium alloys that had been 3-D printed. They noticed some nanoscale precipitates within the 3-D printed materials, but were unable to identify them with their TEM,” Dr. Hornbuckle said. “I am trying to determine the chemistry of the phase using the atom probe, which should help to identify it.”

The University of Alabama is another of the ARL’s partners, and this collaboration led to several published research journal articles.

“They have a different version of the atom probe. They have run some our alloys in their version and ours to compare the differences noted in the same material. This material is actually being scaled up through a number of processes that are relevant to the Arm,” Dr. Hornbuckle explained.

In addition to creating important and meaningful connections, these various partnerships also provide the Army with access to equipment not found at the ARL. Then, the knowledge that Army researchers learn through this joint research can be applied to current problems the Army is facing, as well as to developing future relevant materials.

Dr. Hornbuckle said, “When you see things no other human has ever seen before, it’s very cool to think that I’m helping to push the envelope of new modern materials science, which then obviously is used for the Army. Every time we run a new material we think about how we can help the Soldier with this new discovery.”

Discuss this research and other 3D printing topics at 3DPrintBoard.com or share your thoughts below.

[Images: US Army photos by David McNally]