
After a significant amount of time dedicated to this series, I have made some interesting insights. When you think of metrology and measurement, humans need to understand that we are faulty at what we do. It is difficult to have true precision in measurement. We are prone to error and degrees of various errors. Secondly, no one human has the same perception as another. This leads to various incongruities in the physical realm. We can think in terms of optics, general psychology, and a vast number of phenomena. So how do we escape faulty perception and human error? Well, that seems impossible, but I am going to venture into these topics to show how they affect measurement and metrology as a whole.
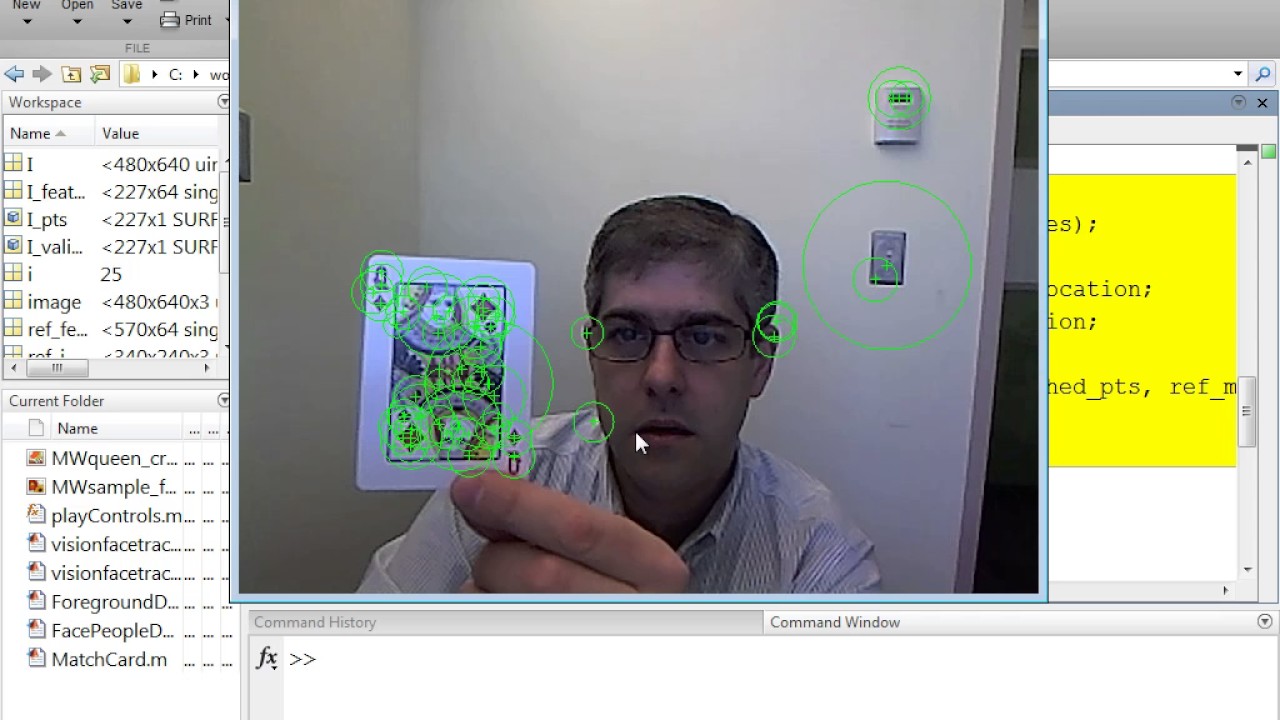
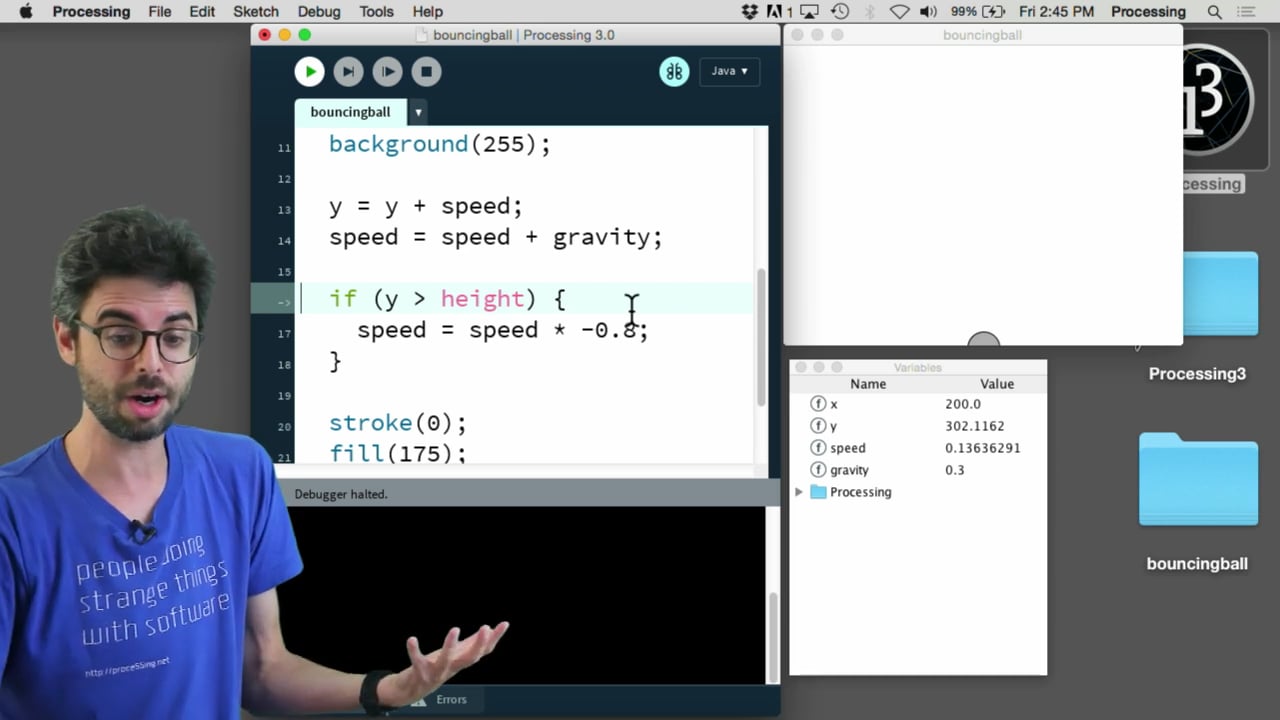
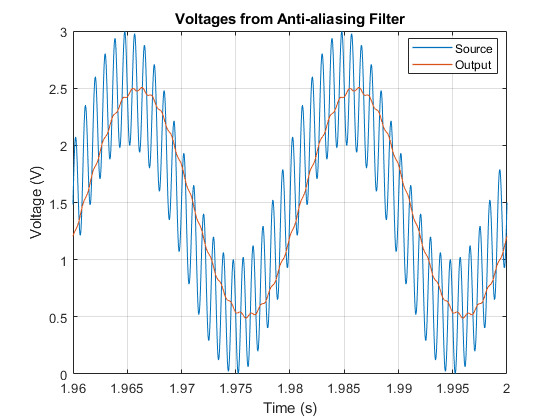
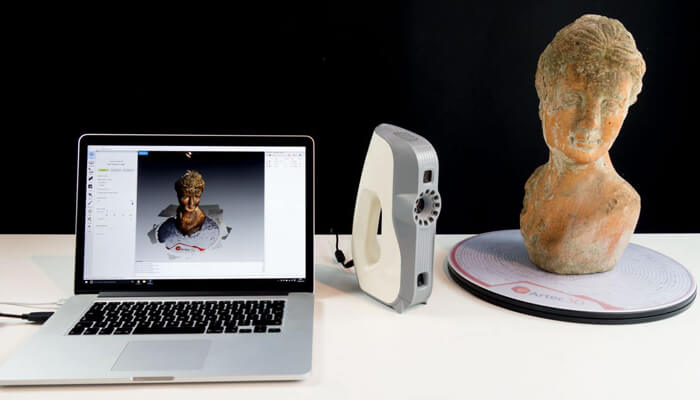
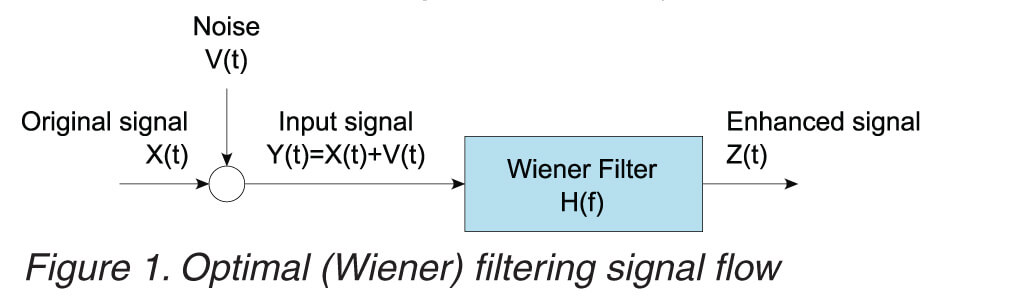
Margin of error is a statistic that shows the amount of sampling error due to random occurrences. When we have a large margin of error, there lies less confidence in the data we collect. In reference to metrology, one can think of a scanning system as our measuring apparatus. When operated by a human, various things and random occurrences can affect the margin of error within a laser scan. This can include an unsteady hand when scanning an item. One could also have a slightly unclean lens that may cause distortion within a 3D scan. The movement of a target for 3D scanning may also affect this as well. There are a slew of items that may cause a 3D scan to contain large margins of error.

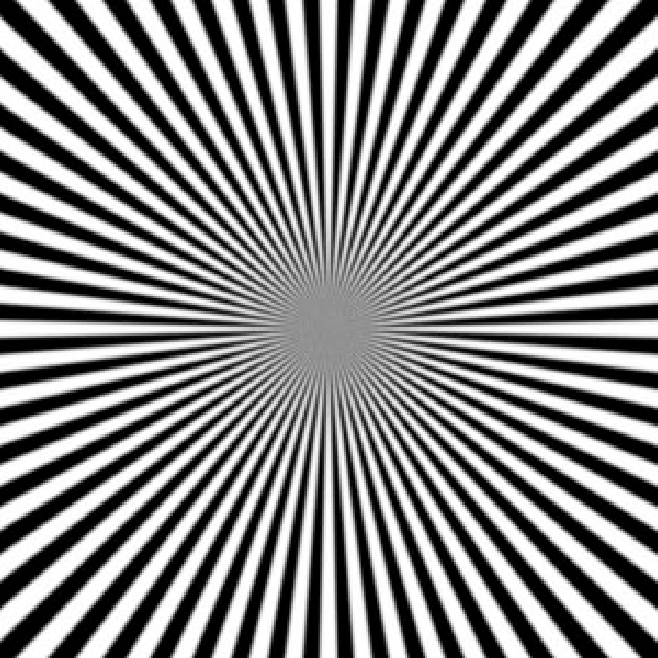
Perception is how we organize, identify, and interpret sensory information in order to understand or represent our environment. Perception includes the ability for us to receive signals that go through our nervous system. This results in physical or chemical stimulation of our sensory systems. This allows us to interpret and understand the information we are bombarded with on a daily basis. Examples of this include how vision occurs through light interacting with our eyes, how we are able to use odor molecules to interpret smell, as well as our general ability to detect sound through pressure waves within the air. Perception is denoted by the receiver though. This means their learning, memory, expectation, and attention are vital for how the signals are interpreted.
I bring these things up as it shines a light on a key difference between machines and humans. Machines have less working experience, expectation, and learning compared to humans. Being able to consistently distinguish a watch in 3D form is natural for most humans, but a machine can be thrown off by slight variations in form. A machine automated process may have less error in terms of pure measurement, but the interpretation of the data is still a difficult task for a machine.

Issues of Perception and Metrology
Perception is typically thought of in two forms:
- Processing an input that transforms into information such as shapes within the field of object recognition.
- Processing that is interloped with an individual and their own concepts or knowledge. This includes various mechanisms that influence one’s perception such as attention.
Through laser scanning, an individual is able to collect data on a physical product. This data needs interpretation for it to have tangible value. A computer device is not readily able to do so. So metrology is a field based on our innate error and psychology as humans. But that does not mean the field is useless, as we humans have an innate desire to make things quantifiable.
The post What is Metrology Part 23 – Error and Perception appeared first on 3DPrint.com | The Voice of 3D Printing / Additive Manufacturing.

![{displaystyle {begin{aligned}f_{1}&={frac {1+sin(k_{1}x)}{2}}\[4pt]f_{2}&={frac {1+sin(k_{2}x)}{2}}end{aligned}}}](https://wikimedia.org/api/rest_v1/media/math/render/svg/7c7aa17b59e171f087bf00e4ea25e757a420e7e2)

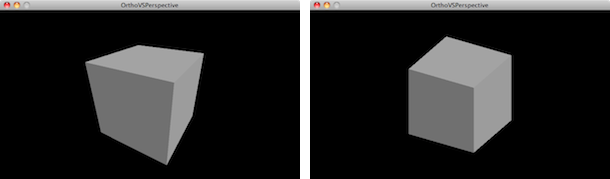


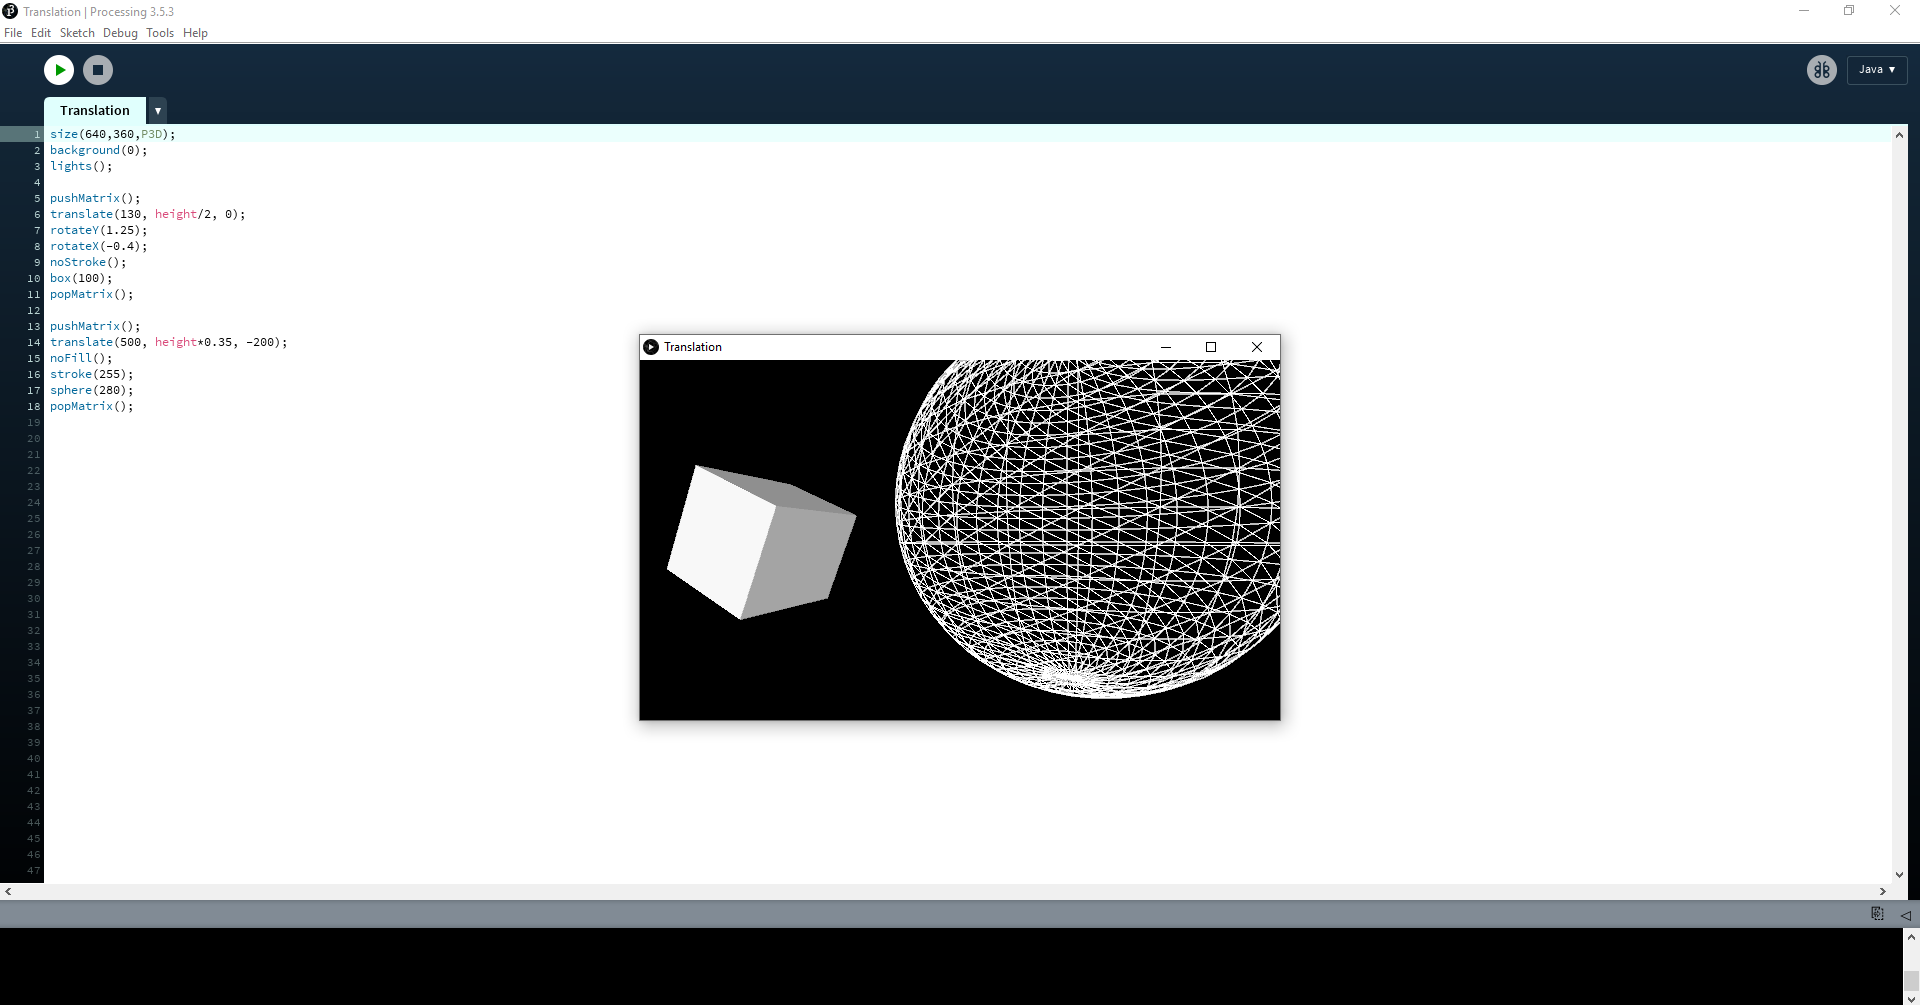
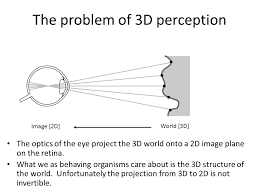 3D Perception